Welcome to the web site for Sediment and Solute Transport on Rivers and Margins (SSTORM) Research Group! Reide Corbett and J.P. Walsh from East Carolina University and the UNC Coastal Studies Institute lead the team.
Check out our research in/on wetlands, estuaries, barrier islands, shelves and groundwater.

Wednesday, January 30, 2013

All good things...

Again, it has been too long since I last posted.  We have continued to be very busy in the field and laboratory, trying to collect as much data before the end of our time here.  Speaking of that…today was our last day in the field…so all samples have been collected for this field season.


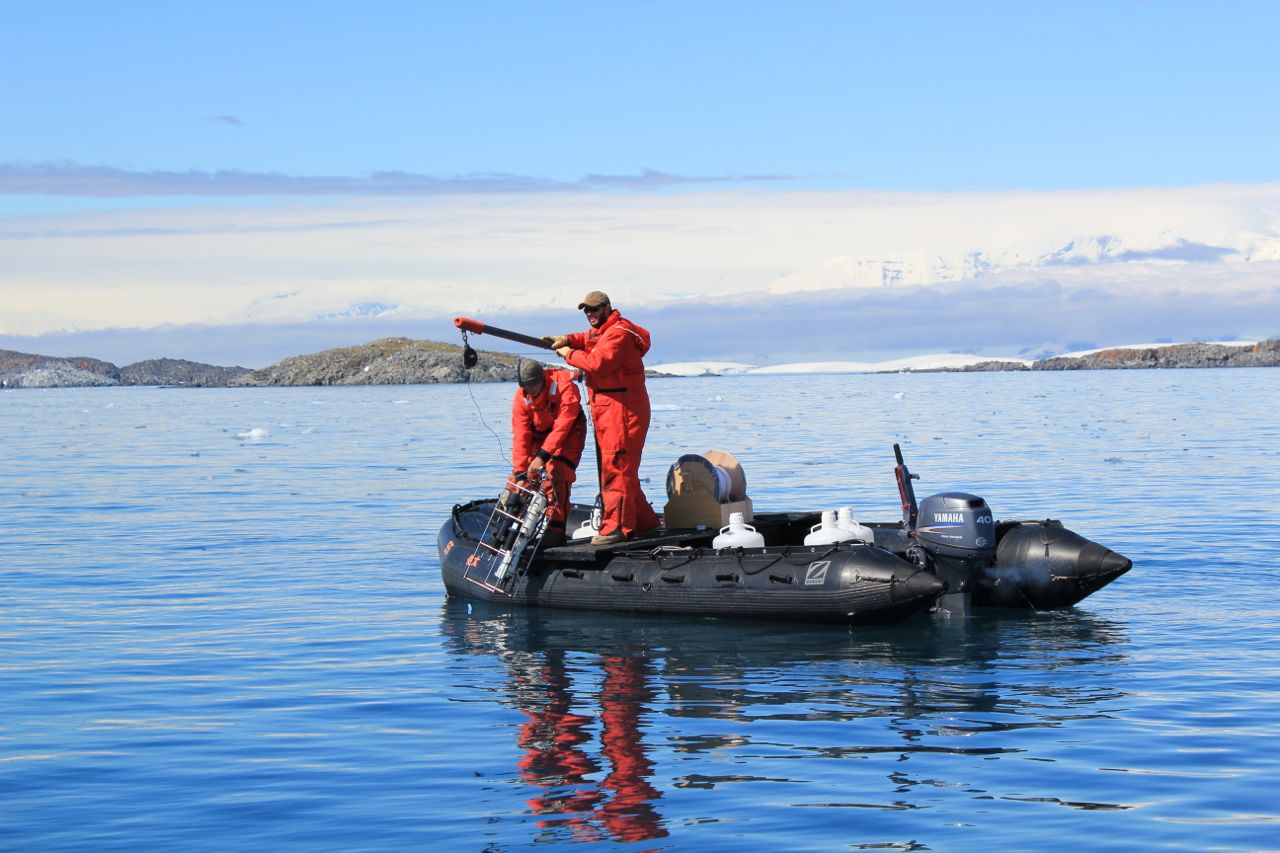
I wanted to highlight a couple things that we have done since I last posted.  One of the exciting finds was a "river" of water coming out from the bottom of the Marr Glacier in the backyard behind Palmer Station.  It was flowing at a fairly high rate for several days.  The water was literally pouring out of the glacier and cascading down the rock face, cascading into the surface water.  We sampled the water directly from the glacier and as it fell into the surface water.  This is essentially one of the end-members we are trying to quantify entering the coastal ocean in this area. We were really excited to have the opportunity to get samples directly from this freshwater source as it entered the ocean.


As we were sampling, the glacier several hundred meters from us began to calve in several places.  I was able to catch a few of the events on camera, although a video would have been better.  You can see a large chunk of ice falling from the glacier in the center of the picture.  Incredible to watch these events occur…the amount of ice entering the ocean through these calving events is pretty impressive.  We have watched these events occur throughout our stay here.  The most impressive event occurred during our last time-series event…an extremely large calving created a 6-foot wave that hit the shoreline that we were working on.  Amazing, but no pictures…we were too busy trying to protect our equipment!


Finally, I was lucky enough top be a part of a live broadcast into several classrooms in Northeast NC.  David Sybert and John McCord (both at UNC CSI) arranged the broadcast and did a great job putting everything together.  You can watch it here…


http://www.ustream.tv/channel/unc-coastal-studies-institute


It was a really cool experience and I hope you have some time to check it out.


We start cleaning up all our gear and packing everything away tomorrow.  We will board the RV Gould on Sunday and start our trek home.  I am looking forward to getting back home…excited by all that I have experienced since arriving in Antarctica!

Sunday, January 20, 2013

Following the Tide

Science has continued and a fast pace since I last wrote.  We only have a bout 1.5 weeks left to complete our fieldwork, but I think we are on track to complete most of the tasks we came down to do.


One of those tasks was to try and evaluate how groundwater discharge along the coast changes with tides.  The plan...we want to measure all the chemical tracers (mentioned in earlier blogs) in the surface water and groundwater every two hours over a 36 hour time period, while imaging the subsurface using resistivity.


Lets start with the tide…crazy thing down here.  The tides change from diurnal (1 high tide and 1 low tide in a lunar day, 24 hours and 50n minutes) to semi-diurnal (2 high tides and 2 low tides in a lunar day)…within the same month…not many places switch between the two cycles.  As the tide changes, so does the interaction of the surface water and groundwaters.  As the tide rises, surface water tends to move into the sediments.  In contrast, as the tide drops, groundwater is more likely to discharge into surface water.  This back and forth movement of the water is often referred to as tidal pumping.   We wanted to evaluate whether this process was occurring here and the possible changes in water chemistry during the process.


So, the site we chose is one of the few areas around here that actually has a sandy beach.  Most of the coast is very rocky.  This area was recently exposed due to the retreating glacier, so it offers a great opportunity to study a type of landform that is likely to be exposed more and more as the glaciers continue to retreat.  The area is know as Point 8 around here, named by the Navy during early surveys of the area (see the first picture, setting up the site).


Again, we collected surface water directly with a pump and groundwater using a drive point sampler (a pvc pipe we worked into the sediment about 30 cm). From these we can evaluate changes in the tracers and nutrients as the tide changes.   We also measured the resistivity of the subsurface.  This is a method that allows us to evaluate the difference between saltwater and freshwater  beneath the ground.  Doing this over the course of the tidal cycle provides direct evidence of subsurface mixing and discharge of water.  Included is a single image of one of the resistivity measurements.  The light blue colors are saltier water and the warm colors are fresher water.  The left side of the image in the water…the last 6 meters of the cable is submerged.  The right side of the image (when this was collected) is not submerged at all.  Again, just to give you a sense of the sort of data we are reviewing to provide information of the subsurface.


Time-series work can be quite exhausting.  Our crew was awake for about 48 hours when it was all said and done, preparing, running experiments, breaking down and cleaning up.  But the data looks really great.  Being out on the "ice" and away from station for that long was also quite interesting.  The glacier was calving (large ice chunks breaking off) all around us.  On large calving event actually created a small local tsunami about 7 ft high.  Impressive in its power…creating havoc on some of our equipment.  Also, there were times when we had to deal with the locals…penguins and seals.  That was exciting at times as well.  But, some of the images that mother nature provided us are better than any data we could have ever collected.  The last image is a picture I took at about 5am.  The sky never gets dark, but this is equivalent to a sunrise over the glacier…magnificent.


What a great experience…all around!

Monday, January 7, 2013

Life at PalmerÅ Jared Crenshaw

Post from Jared Crenshaw, ECU Graduate Student…

Life on Palmer is amazingly comfortable considering the often harsh conditions and location of the station. Over the past couple of weeks the Corbett team has adjusted to living in the Antarctic and being part of the station community. Palmer can support a maximum of 46 people, so everyone has to do their part to keep things running. Everyone here is always willing to pitch in, making life here much more pleasant.

Over the past few weeks we have visited a majority of the areas we have access to in order to gain a better understanding of how groundwater mixes with the waters off of Anvers Island. For the remainder of our stay we plan to continuously monitor a few key areas to see how changing weather, water, and ice conditions impact those locations.

We are currently preparing for a 24-hour monitoring period in which we will measure the changing concentrations of Radium and Radon, as well as changes in the electrical properties of the water near the shoreline. I'm really looking forward to getting an opportunity to camp out by the shore. We have seen seals relaxing on this stretch of sandy beach before, so we are hoping they have decided to relocate as this may complicate our efforts.

David Hawkins and I were out sampling a few days ago when we came very close to waking this leopard seal from his nap on the ice. I hear they can be quite unpleasant!

JCrenshaw


Happy New Year from Palmer Station

Sorry that it has been so many days since I last posted on the Blog…life has been quite busy!  We have been very busy adjusting to our new surroundings, prepping field gear, and sampling in our new surroundings and platform (Zodiacs)!


I thought I would start with some of the science we are doing while on science….I will follow up with another Blog that focuses on "life" on station.


We arrived on Station on the 19th of December.  Since we arrived, we have been actively sampling the surrounding waters.  We are limited in how far we can go away from station by Zodiac (2 nautical miles) for safety reasons.  So, we have clearly focused this aspect of our research on nearshore processes…quantifying groundwater and freshwater discharge to the coastal ocean.  The first image is of the study area (within the blue halo) where we are currently focusing our efforts...Palmer Station is near the center of the image.  The individual points represent the sites we have occupied (up to about the end of last week).  We are now focusing in on a few areas on the map that we will sample weekly for the next 3-4 weeks.  We will also do some work on land (look for the shaded boxes)…collecting groundwater directly with a drive point sampler and imaging the subsurface (the shallow surficial aquifer) using electrical properties.


Sampling off of zodiacs does have its challenges…primarily space, but we also need to work in the right safety equipment for the conditions (note the bright orange Mustang suits).  We have a lot of equipment and are collecting large volumes of water, so we can only sample one site before we have to unload those samples and load additional sample bottles.  Like the work we were doing on the LMG a couple weeks ago, we are sampling for several tracers (radium, radon, helium, oxygen isotopes) that will give us information on the source of water and for a few specific chemicals that plants need to grow (nutrients – nitrogen, phosphorus, silica, and iron).  We also drop a CTD at each station to tell us something about the water column…so, what does CTD stand for? The 'C' in CTD is usually the hard one…a hint is that it refers to the electrical properties of the water that is a function of the salinity.


I have included some pictures form a say of sampling last week.  Some brash ice had blown in the night before, making navigating away from Station and bit tedious and slow.  The picture is of Leigha Peterson (Coastal Carolina University graduate student) helping me navigate the best route toward open water.  On this particular day, we were able to use two Zodiacs…this makes logistics much easier for us, allowing one boat to shuttle water back to Station while the remaining Zodiac continues to sample.  The third picture shows how crowded the boat can become while sampling.  The final picture shows David Hawkins (aka. The Hawk) and Jared Crenshaw (both ECU graduate students) lowering the CTD on station.


Let the sampling for the day commence…